Infographic Projects
Portfolio Disclaimer
The design examples showcased in this portfolio were created as part of my past employment and freelance clients. All work is presented solely for the purpose of demonstrating my skills and experience as a designer. The intellectual property rights of these designs belong to the respective employers or clients for whom they were created. These examples are not available for commercial use, reproduction, or distribution without the express permission of the copyright owners. If you have any questions about the use of this work, please contact me directly.
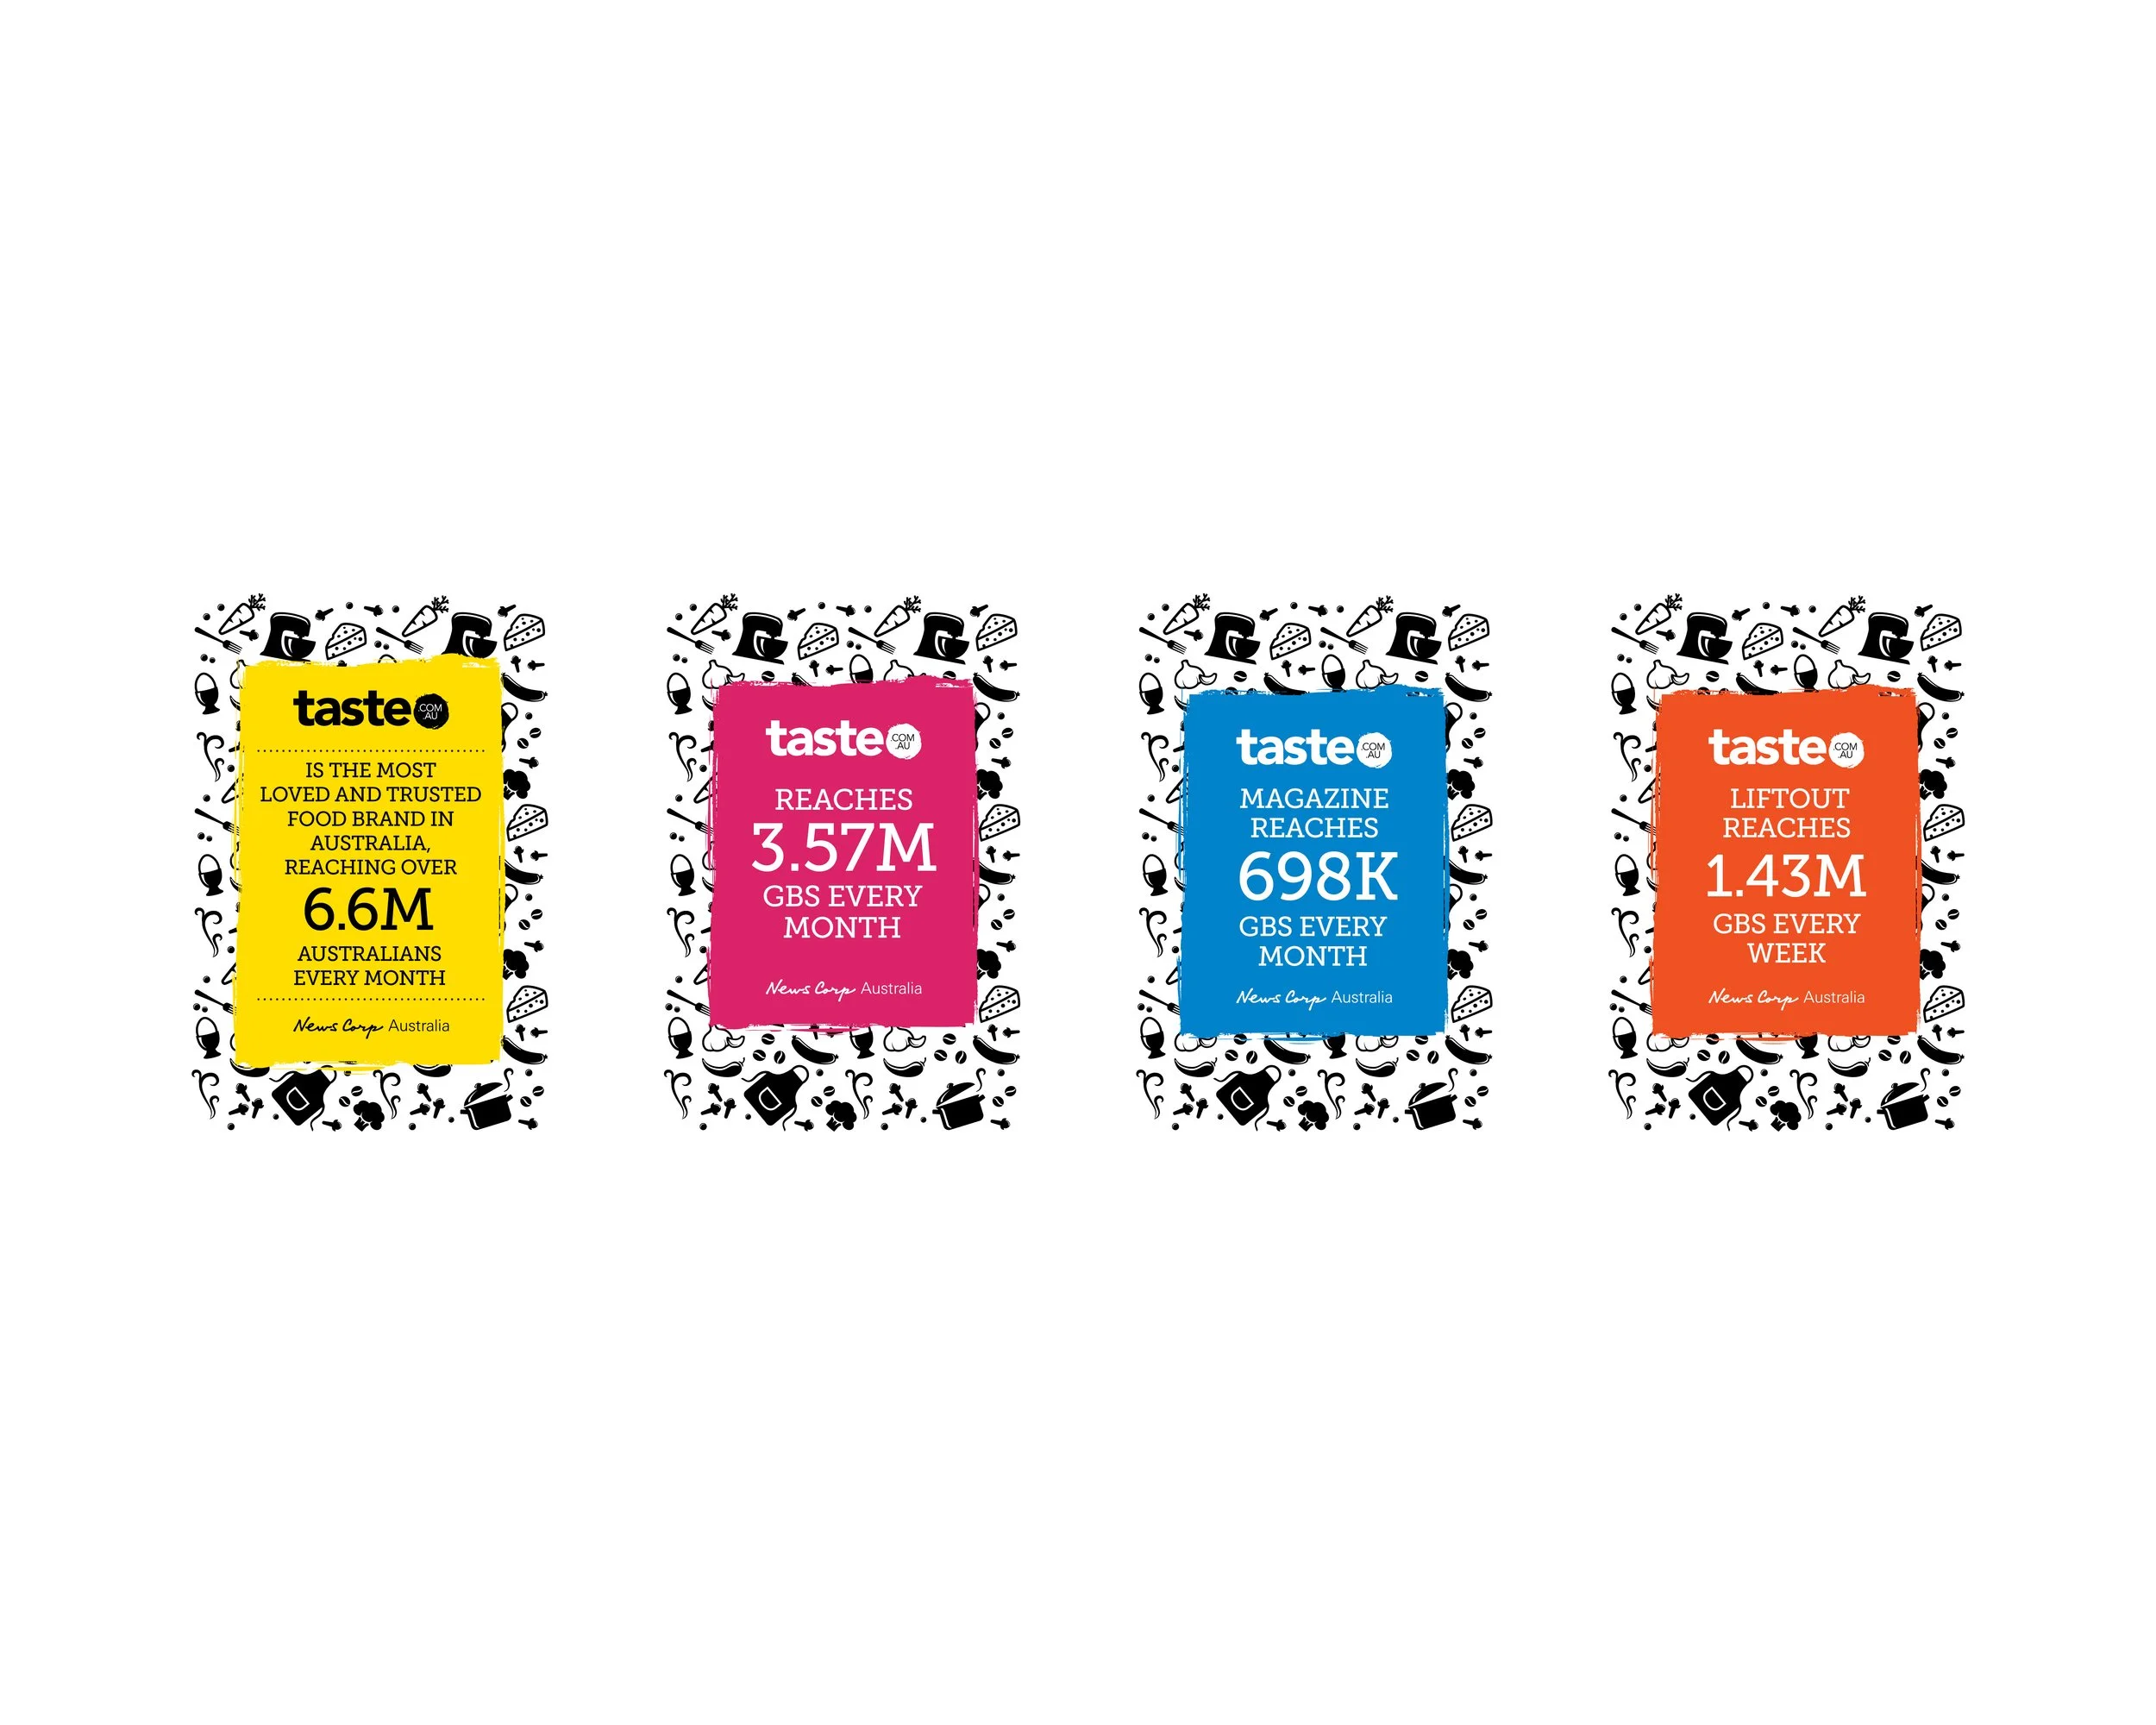
Taste.com.au Infographic
A collaboration with News Corp Australia, it highlights the commitment to engaging food lovers with impactful design. This vibrant infographic, showcases: 6.6M monthly users, 1.43M weekly liftout GBS, 3.57M monthly GBS, and 698K monthly magazine GBS.
Credit: News Corp Australia
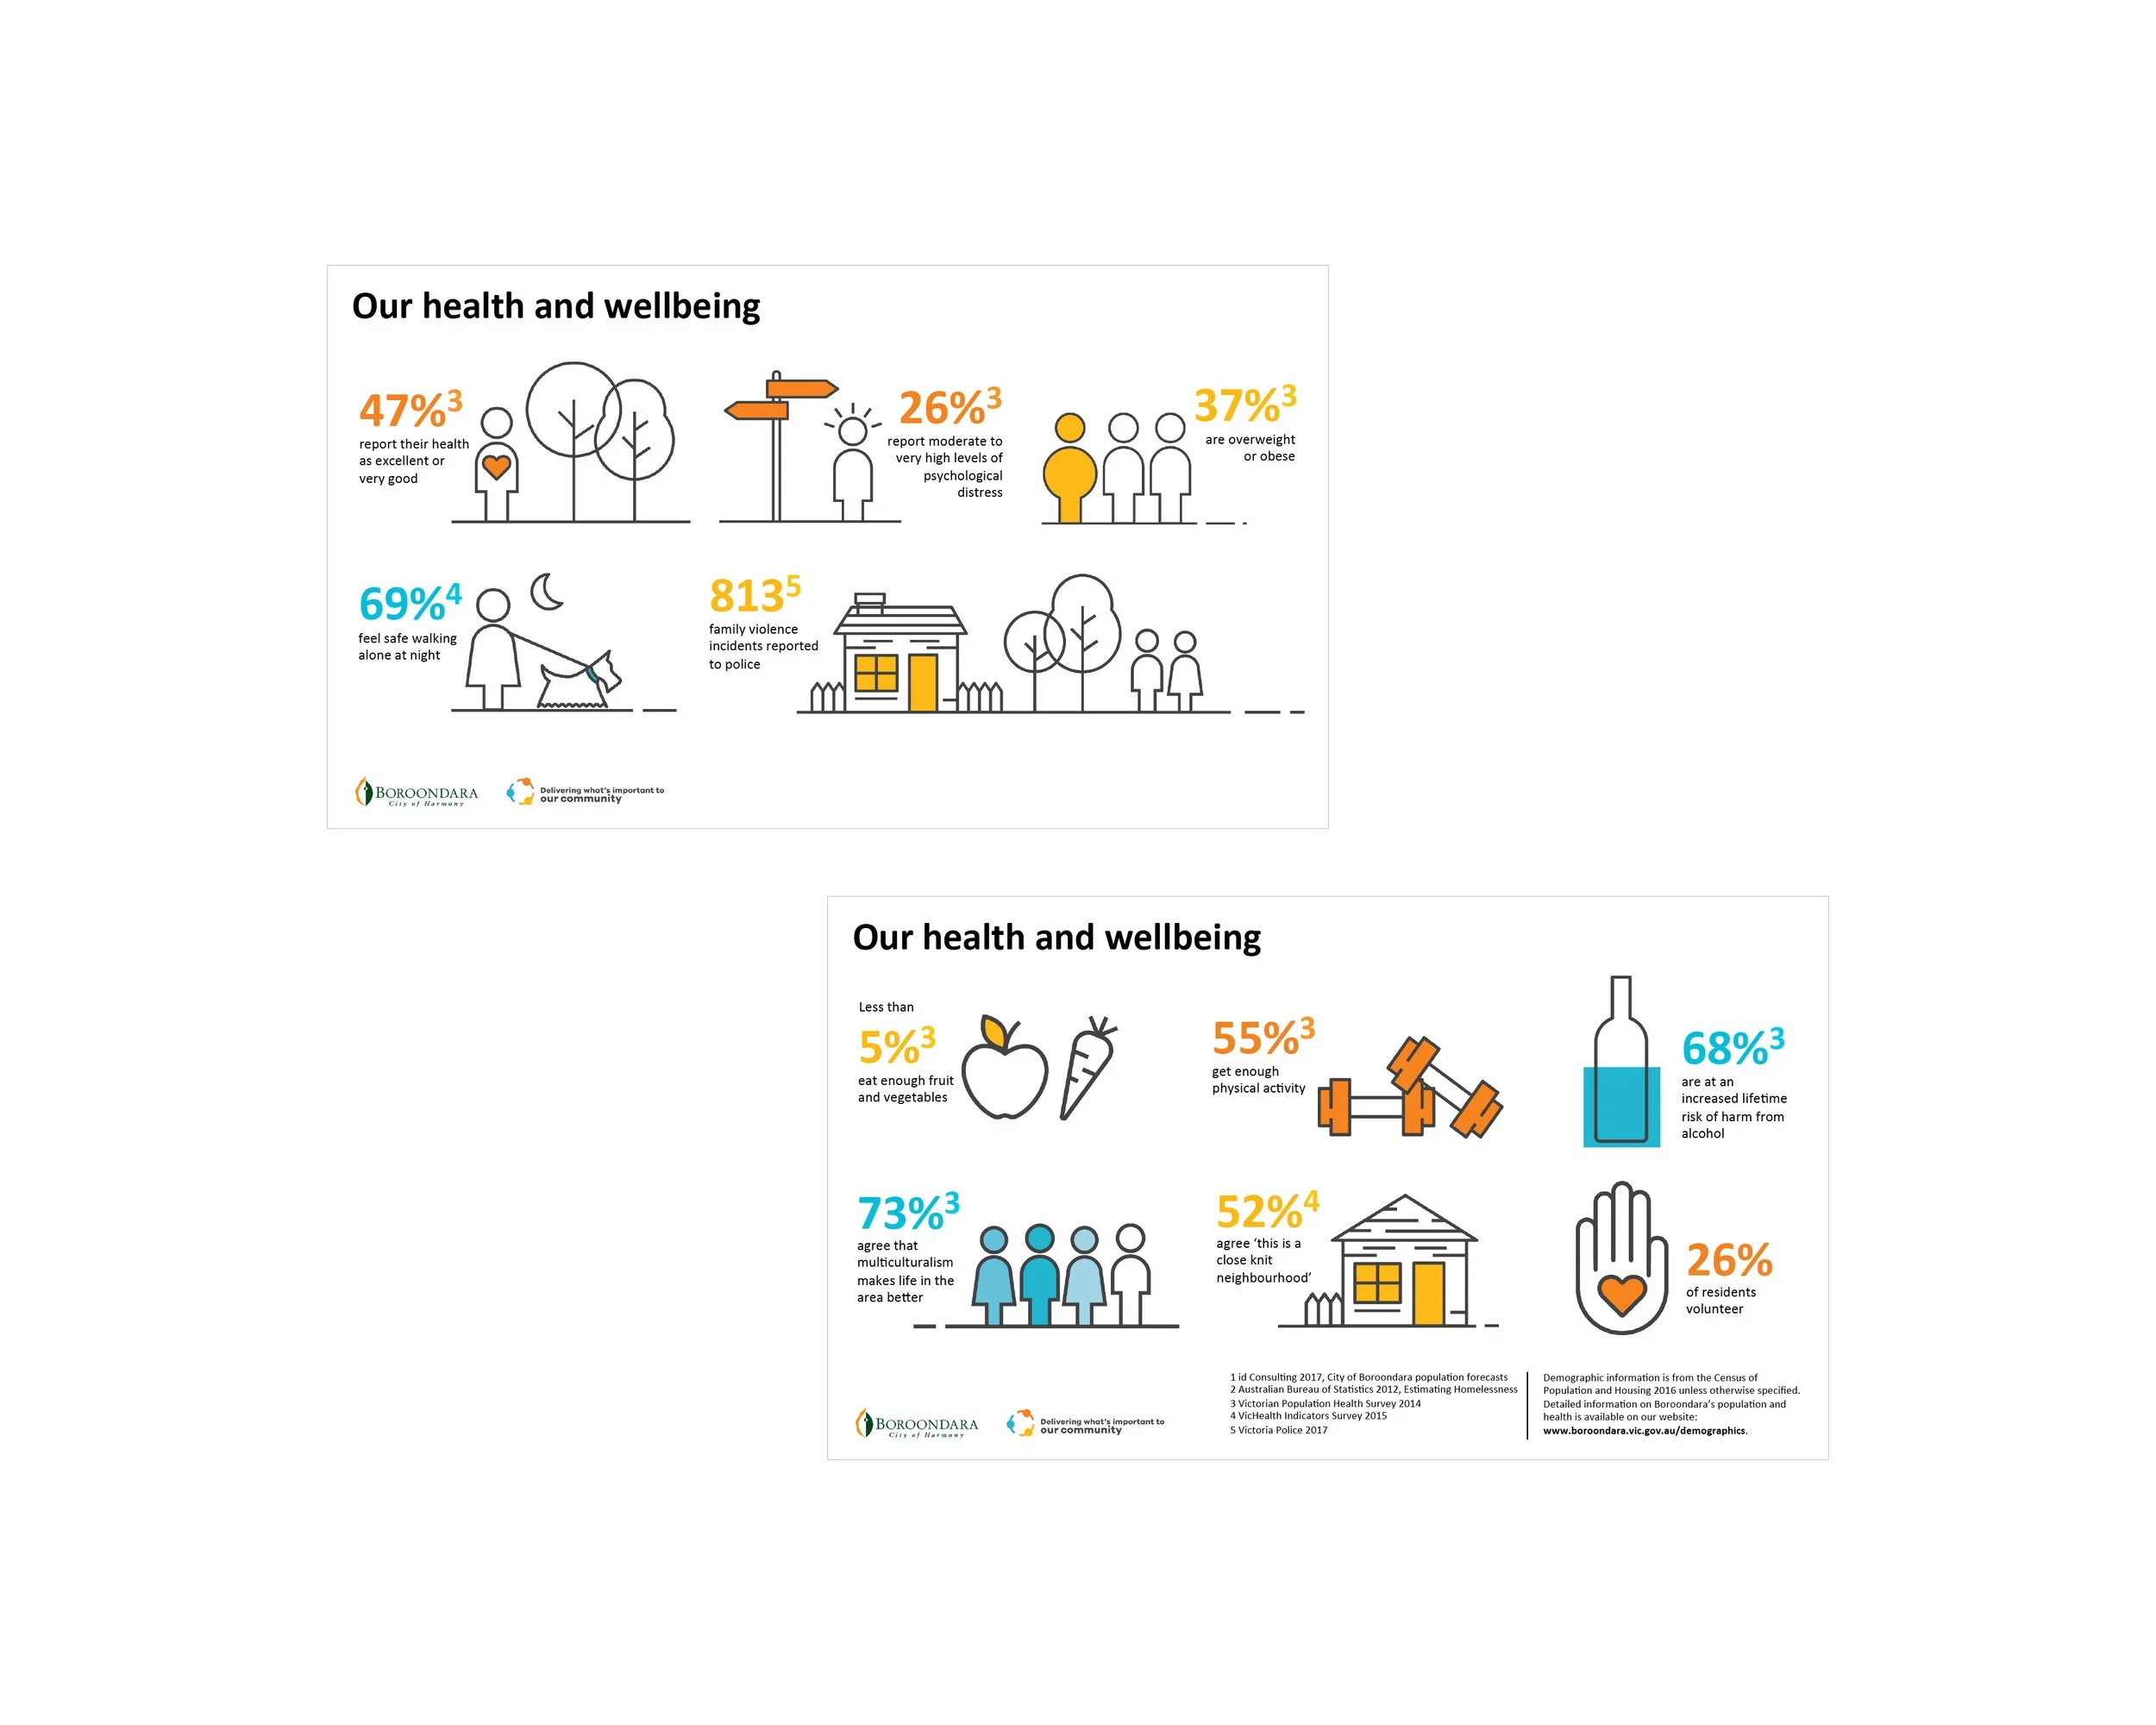
Boroondara Health and Wellbeing Infographic
This infographic, designed to highlight health priorities in Boroondara, presents key community wellbeing insights. It reveals that residents report their health as excellent or very good, and the same percentage feel safe walking alone at night. Focused on delivering what matters most to the community, this project uses clear, concise visuals to communicate health and safety metrics effectively.
Credit: City of Boroondara
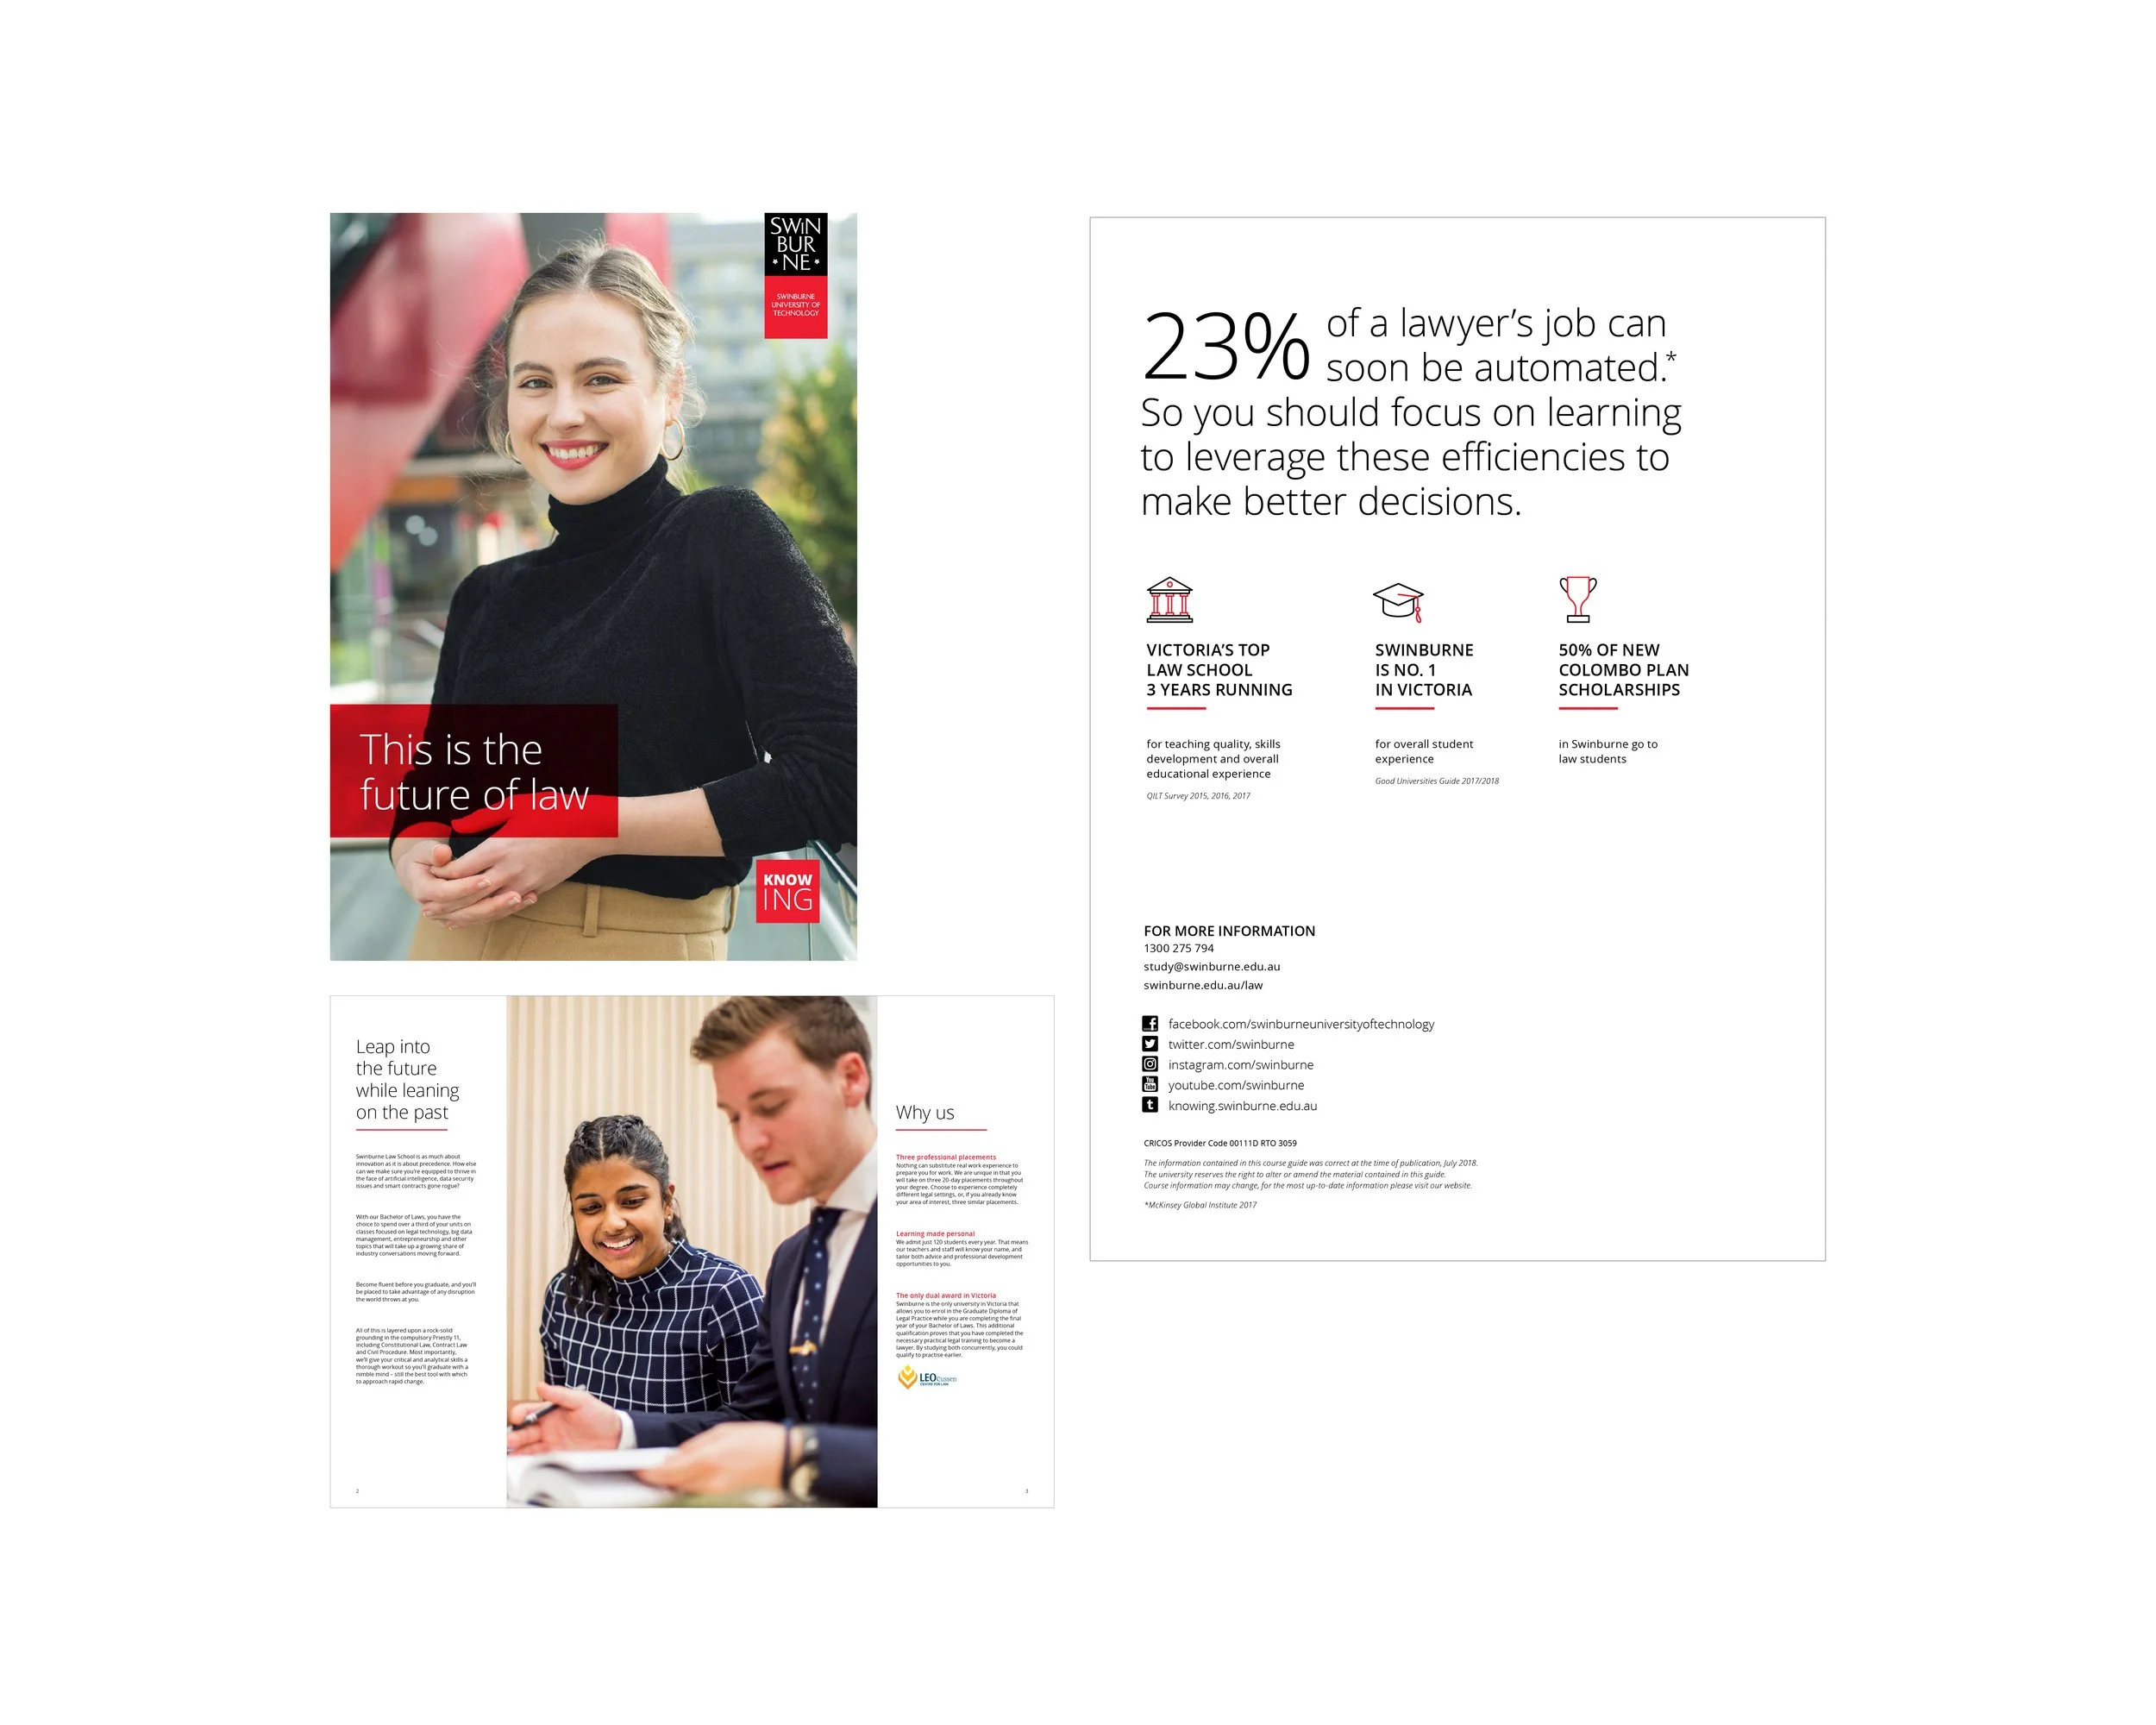
Swinburne Law Infographic
This infographic, created by Swinburne University of Technology, explores the future of law, highlighting that 23% of a lawyer’s job will soon be automated. It encourages leveraging these efficiencies to make better decisions. Key features include a top-ranked law school with 3 years of running, #1 ranking in Victoria, and Colombo Plan scholarships for students. Contact details and social media links are provided for more information.
Credit: Swinburne University of Technology
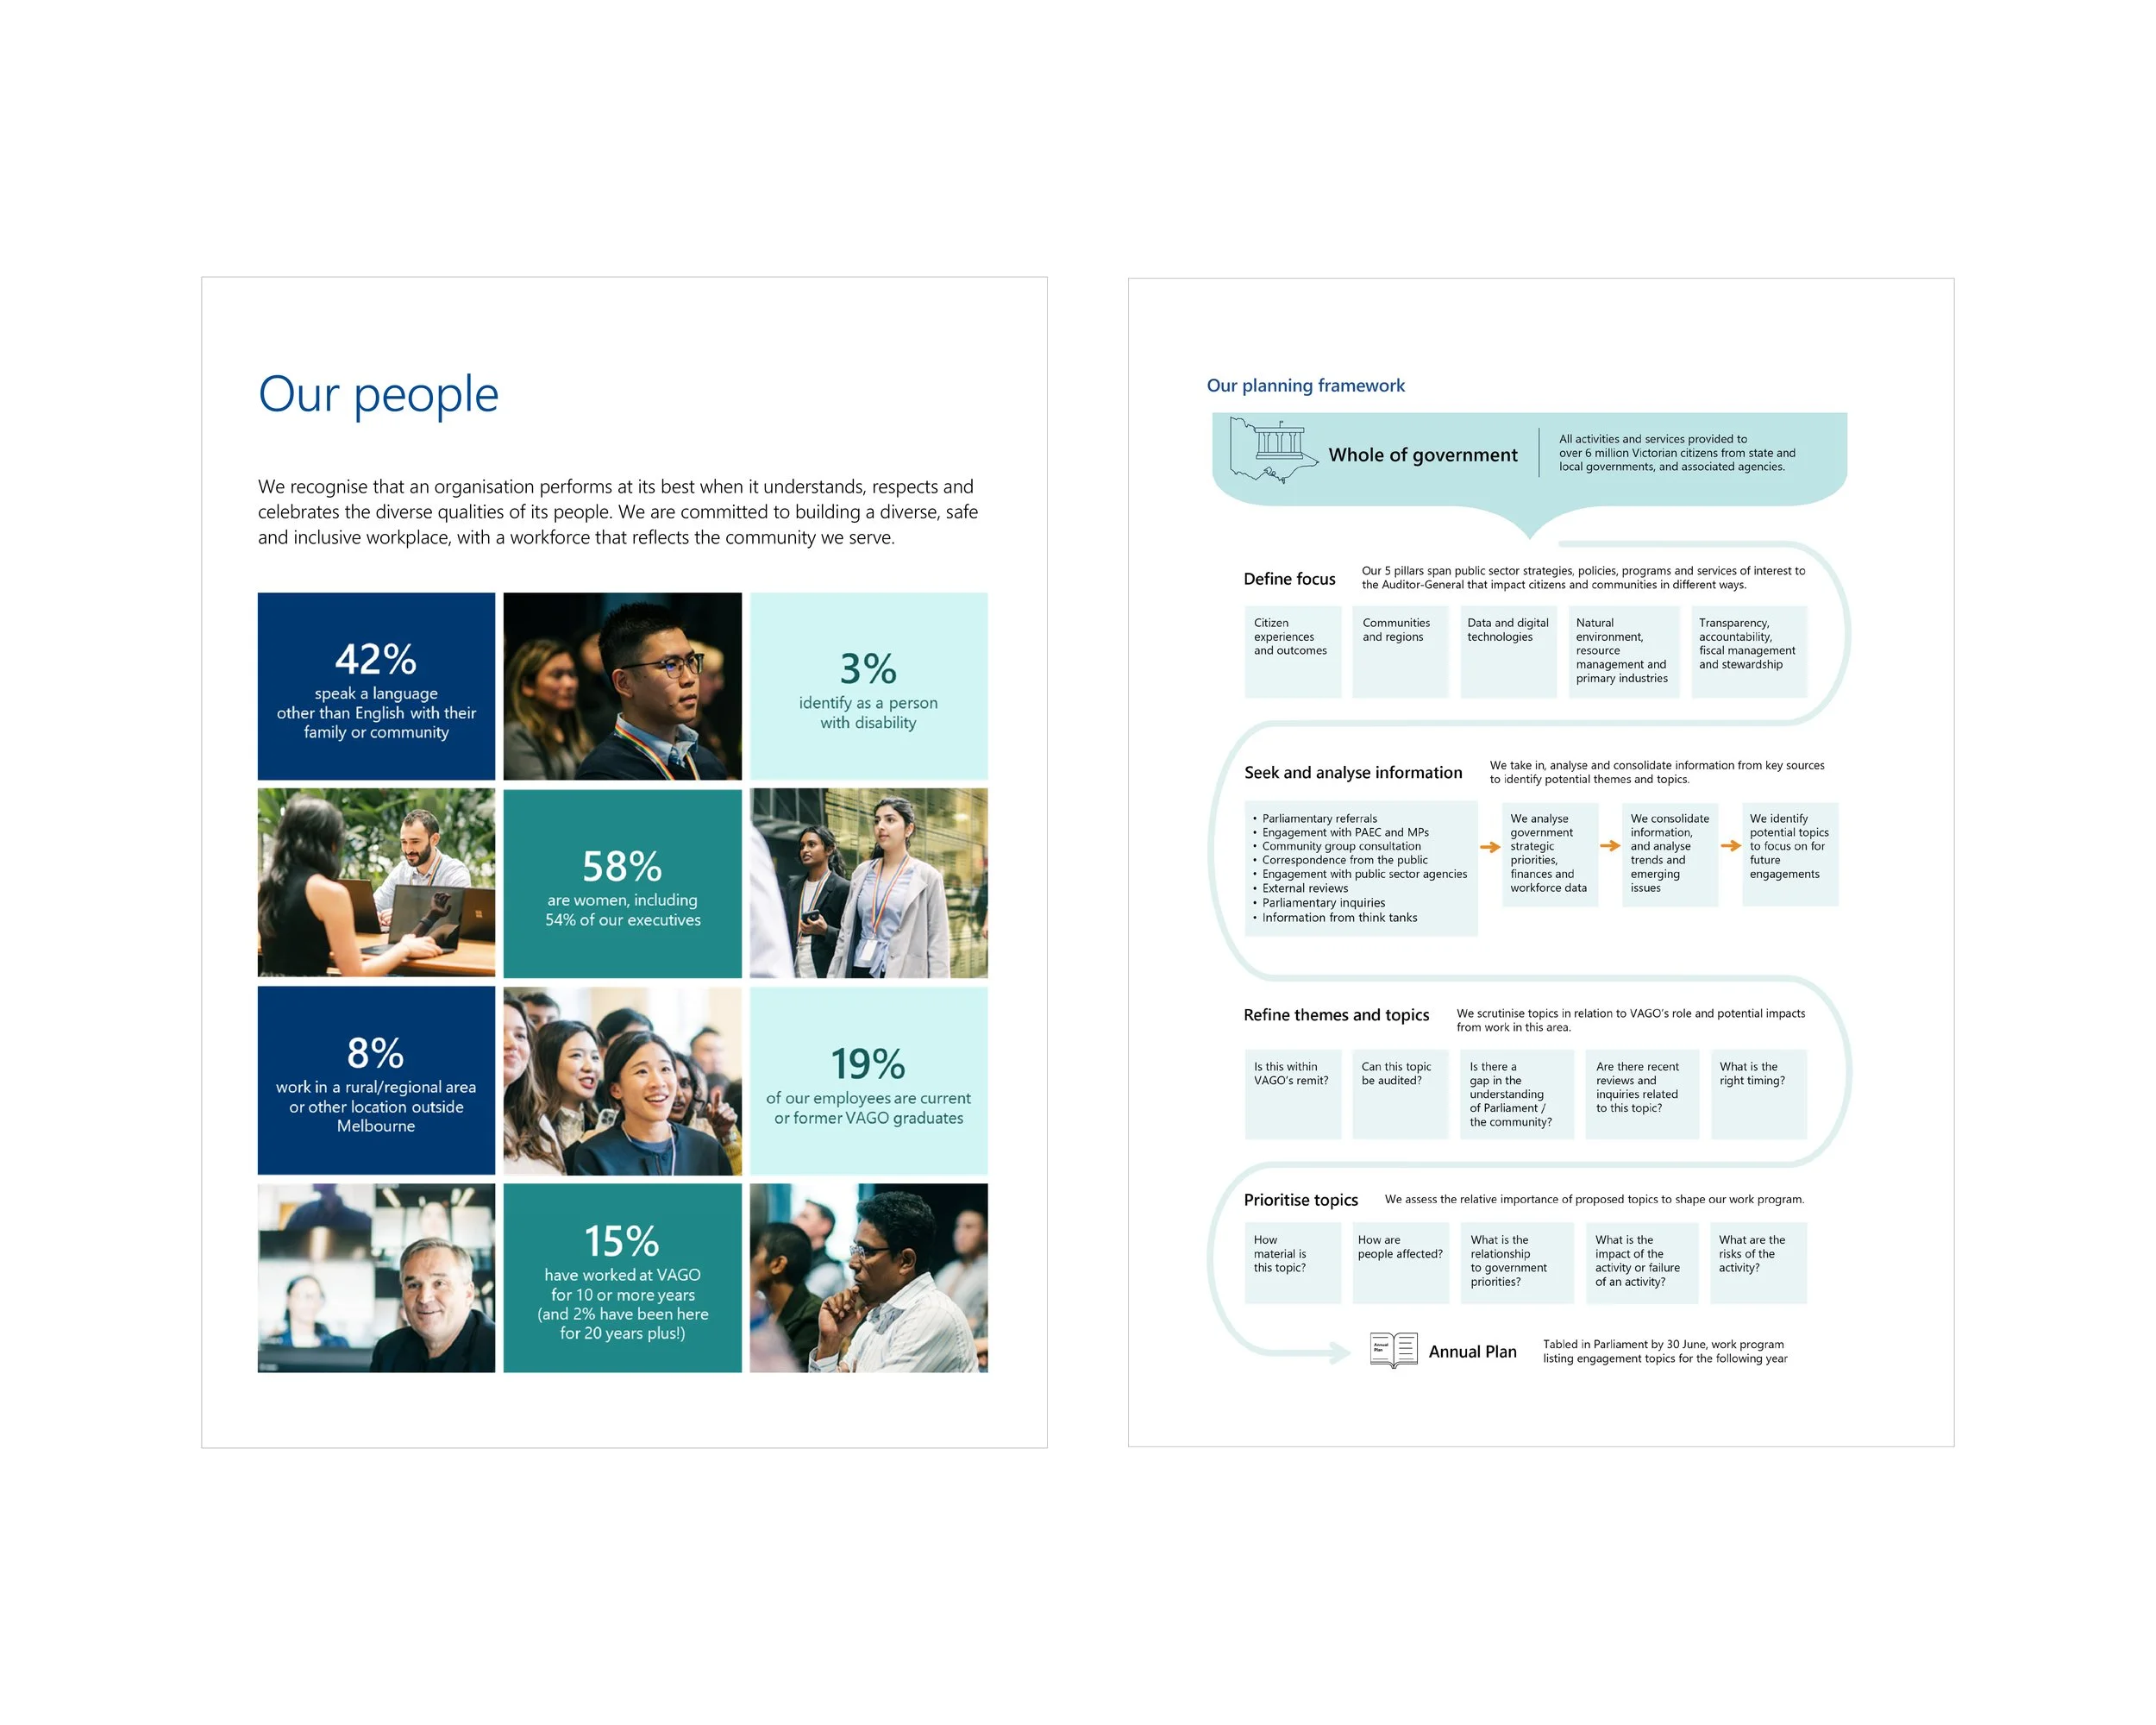
Victoria Auditor-General’s Office Report Infographic
This infographic, crafted for the Victoria Auditor-General’s Office, showcases the diversity and planning framework of our workforce. It highlights that 42% speak a language other than English, 58% are women, 8% work in regional or other locations outside Melbourne, 19% are current VAGO graduates, and 15% have worked at VAGO for 10 or more years. Designed to reflect a diverse, safe, and inclusive workplace, the report also outlines a whole-of-government planning approach, detailing steps to define focus, seek information, refine themes, and prioritise topics for the annual plan.
Credit: Victoria Auditor-General’s Office
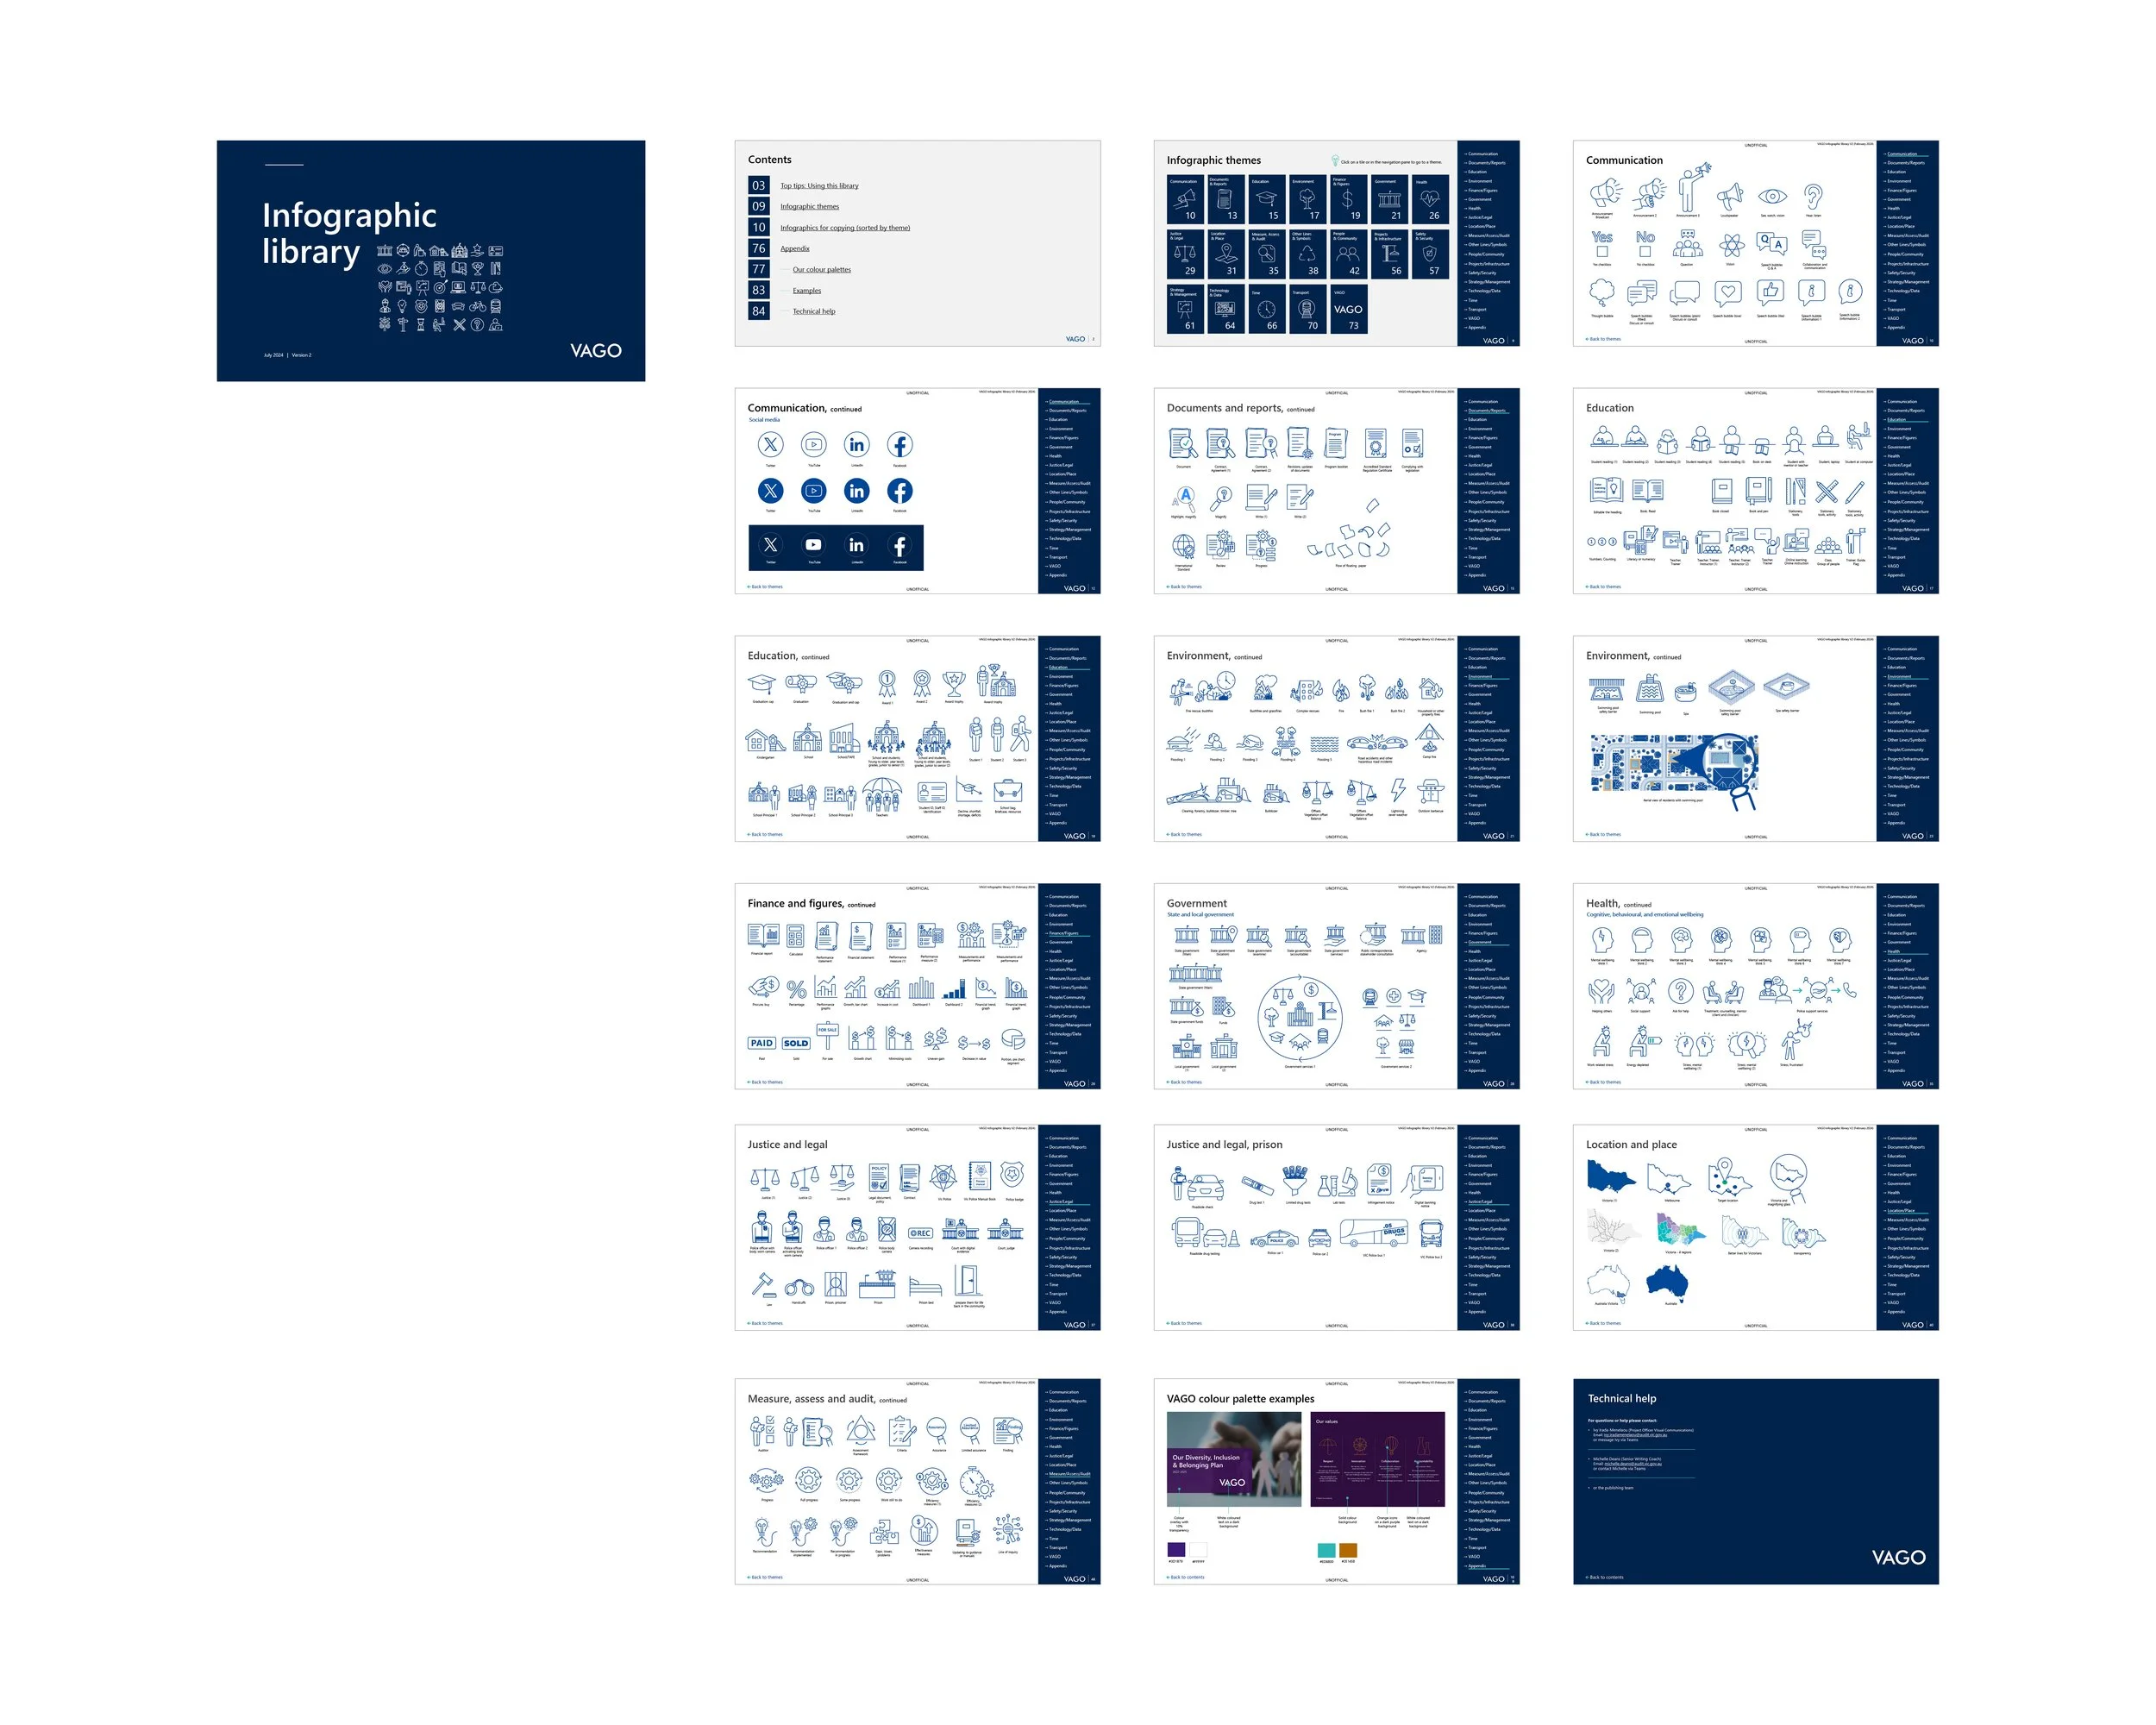
VAGO Infographic Library
An infographic library is a curated collection of visual assets, including icons, illustrations, and design guidelines, created to ensure consistency and clarity in an organisation’s communication materials. Its purpose is to streamline the creation of reports, presentations, and other media by providing reusable, on-brand graphics that enhance data storytelling and audience engagement. This project, the VAGO Infographic Library, was developed as part of my campaign work for the Victorian Auditor-General’s Office. I designed a versatile set of icons and illustrations across various themes like Education, Health, and Government, along with color palettes and technical guidelines, to support VAGO’s reporting needs. This work demonstrates my ability to create structured, functional design systems that empower organisations to communicate effectively.
Credit: Victoria Auditor-General’s Office


